Analyzing the Reputation Report
Your overall star rating is only part of the story. The Reputation Report provides a focused, analytical breakdown of your customer sentiment over a specific time period. It allows your team to visualize review trends, track exactly how many negative reviews are being ignored, and measure your average crisis response time.
Accessing and Filtering the Data
Navigate to Reports in the left sidebar, then select the Reputation tab. The report will automatically load using your default dashboard filters.
(Note: The Reports module uses a unified tab bar. If you switch between the Executive, Locations, Reputation, and Listing Accuracy tabs, your chosen filters seamlessly pass through to the next view.)
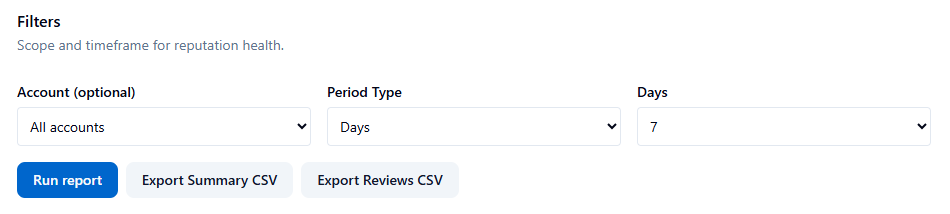
Configuring Your Scope:
-
Account (Optional): Filter the report to a specific Google Business account, or leave it blank to analyze your entire organization.
-
Period Type: Select Month to pick a specific calendar month, or select Days to view a rolling window of 7, 30, 60, 90, 180, or 365 days.
-
Click Run report to refresh the dashboard.
Understanding the Dashboard Metrics
The dashboard is divided into three core analytical sections:
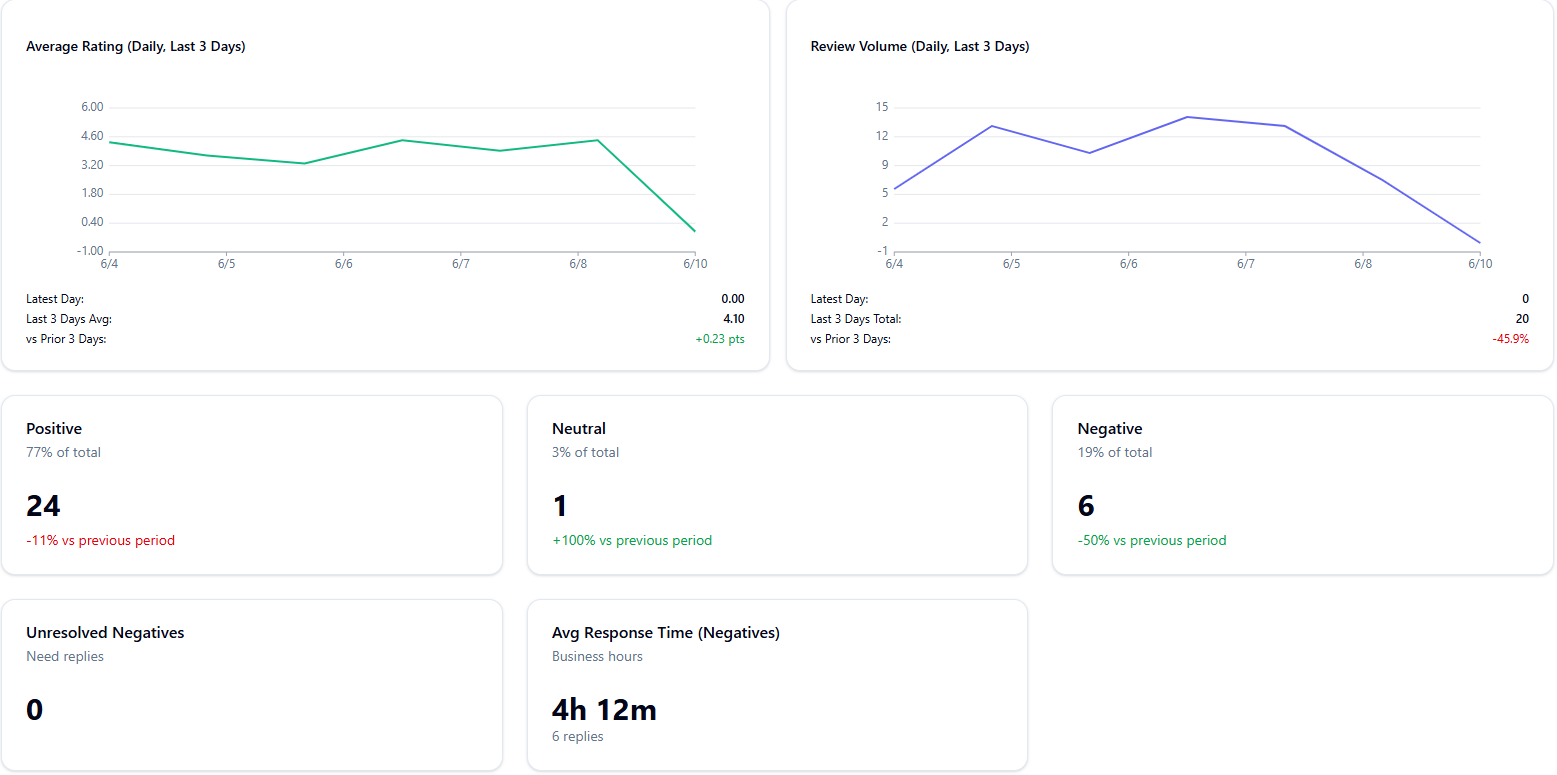
The Reputation Trends Chart
Located at the top of the report, this chart visualizes your sentiment pattern over the selected time period. It is highly useful for spotting sudden dips in customer satisfaction and correlating them with specific real-world operational events (e.g., a massive spike in negative reviews the week a new POS system was rolled out).
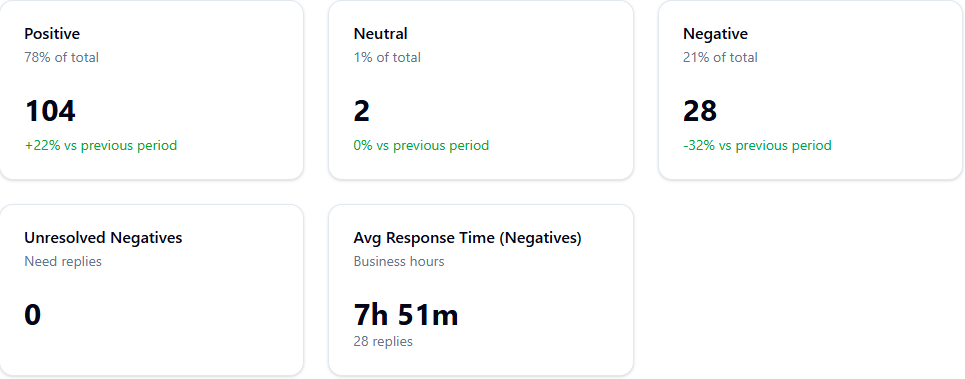
Sentiment Breakdown Cards
Three color-coded metric cards break down your exact review volume by sentiment:
-
Positive (Green): Count of 4- and 5-star reviews.
-
Neutral (Gray): Count of 3-star reviews.
-
Negative (Red): Count of 1- and 2-star reviews.
Each card clearly displays the sentiment as a percentage of your total review volume, alongside an automatic percentage change versus the previous period so you can immediately tell if performance is improving or degrading.
Response Performance Cards
These cards measure how well your team is managing brand risk:
-
Unresolved Negatives: The total count of 1- and 2-star reviews that currently do not have an owner reply. A high number here represents a severe reputation risk, as prospective customers are reading complaints that appear completely ignored by management.
-
Avg Response Time (Negatives): The average number of hours it takes your team to reply to a negative review. This is calculated strictly during business hours, so weekend delays do not artificially penalize your team's metrics.
Exporting Your Review Data
The Reputation Report features two distinct export options depending on your reporting needs:
-
Export Summary CSV: Downloads a high-level spreadsheet containing the core sentiment metrics (positive/neutral/negative counts, unresolved total, and average response time).
-
Export Reviews CSV: Downloads the raw, granular data. This exports the full list of every individual review received within the period, including the actual review text, making it perfect for feeding into a customer care team or utilizing in staff training.
Best Practices & Interpretation Tips
-
Establish a Triage Routine: High unresolved negative counts will destroy local conversion rates. Run a 7-day report every single morning to catch and triage emerging issues early.
-
Set Clear Benchmarks: Aim to maintain an 80%+ positive sentiment ratio and mandate a target response time of under 24 business hours for all negative feedback.
-
Acknowledge Everything: Respond to all negative reviews promptly. Even a brief, templated acknowledgment offering an offline contact method drastically reduces the public perception of brand neglect.
- ✓ Navigate to the Reputation tab in the Reports module.
- ✓ Select your Period Type (e.g., Month) and hit Run report.
- ✓ Review the Reputation Trends chart to spot operational anomalies.
- ✓ Compare your current period versus the previous period using the % change indicators on the sentiment cards.
- ✓ Check your Unresolved Negatives count and instruct your team to reply to them immediately.
- ✓ Export the Reviews CSV for deep-dive textual analysis of customer complaints.
AI answers may be approximate. Verify critical steps in official docs above.