Generating Executive Reports
When communicating value to stakeholders or agency clients, you need a macro-level view of your digital performance. The Executive Report serves as your ultimate high-level summary, seamlessly combining Google Business Profile (GBP) metrics, review health, AI-driven narrative insights, and your overall social media performance. Navigate to Reports in the left sidebar, and select the Executive tab. The report will automatically load using your default dashboard filters.
Filtering and Report Navigation
The Reports module features a unified tab bar at the top, allowing you to switch between Executive, Locations, Reputation, and Listing Accuracy. Switching between these tabs automatically passes your current filters through to the next report, ensuring a frictionless workflow.
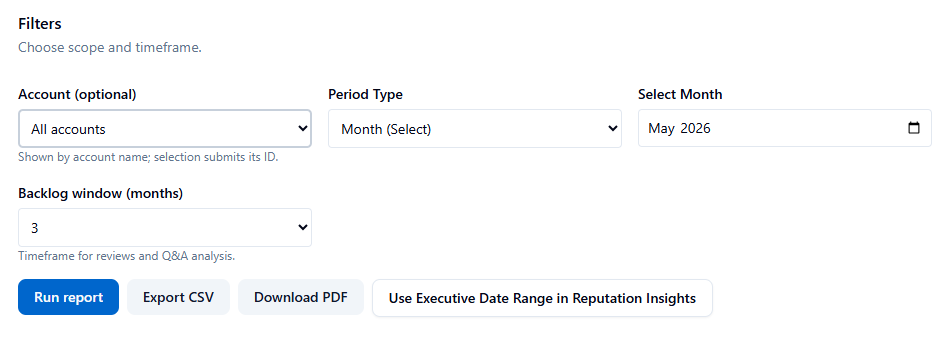
Configuring Your Data Scope: Use the Filters Panel to define exactly what data the report should analyze:
-
Account (Optional): Select a specific Google Business account to isolate metrics for a single client, or leave it blank for a global, organization-wide view.
-
Period Type: Choose how you want to measure time. Options include:
-
Day / Week (Today or the last 7 days)
-
Month / Quarter / Year (Aligns perfectly with calendar billing cycles)
-
Custom Date Range (Pick exact start and end dates)
-
Custom (Days) (A rolling window of 7, 30, 60, 90, 180, or 365 days)
-
-
Backlog Window: Set how far back the system should look (1, 3, 6, or 12 months) to identify unanswered customer Q&As on Google.
Once your filters are set, click Run report to fetch the data.
Understanding the Report Sections
The Executive Report is broken down into easily digestible sections, perfect for board meetings or client presentations.
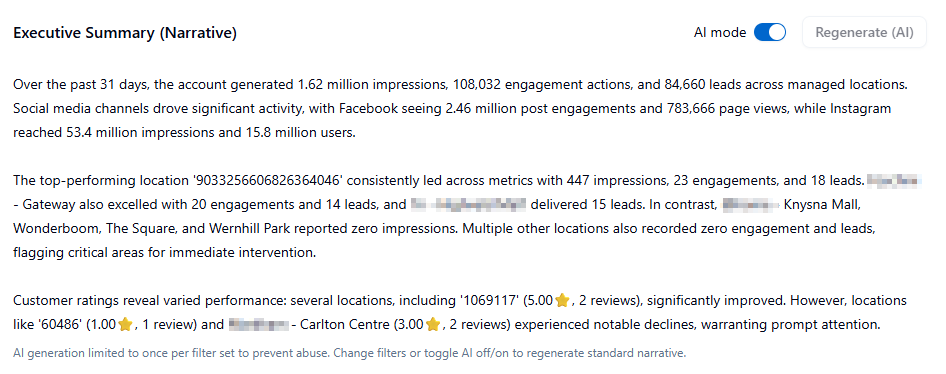
The Performance Narrative An AI-generated summary sits at the top of the page. This analyzes your trend momentum and provides key takeaways. It is generated independently of the raw data tables, making it perfect to simply copy-paste into stakeholder emails or executive summaries.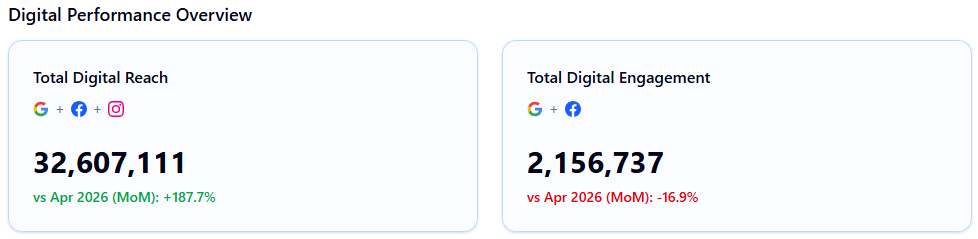
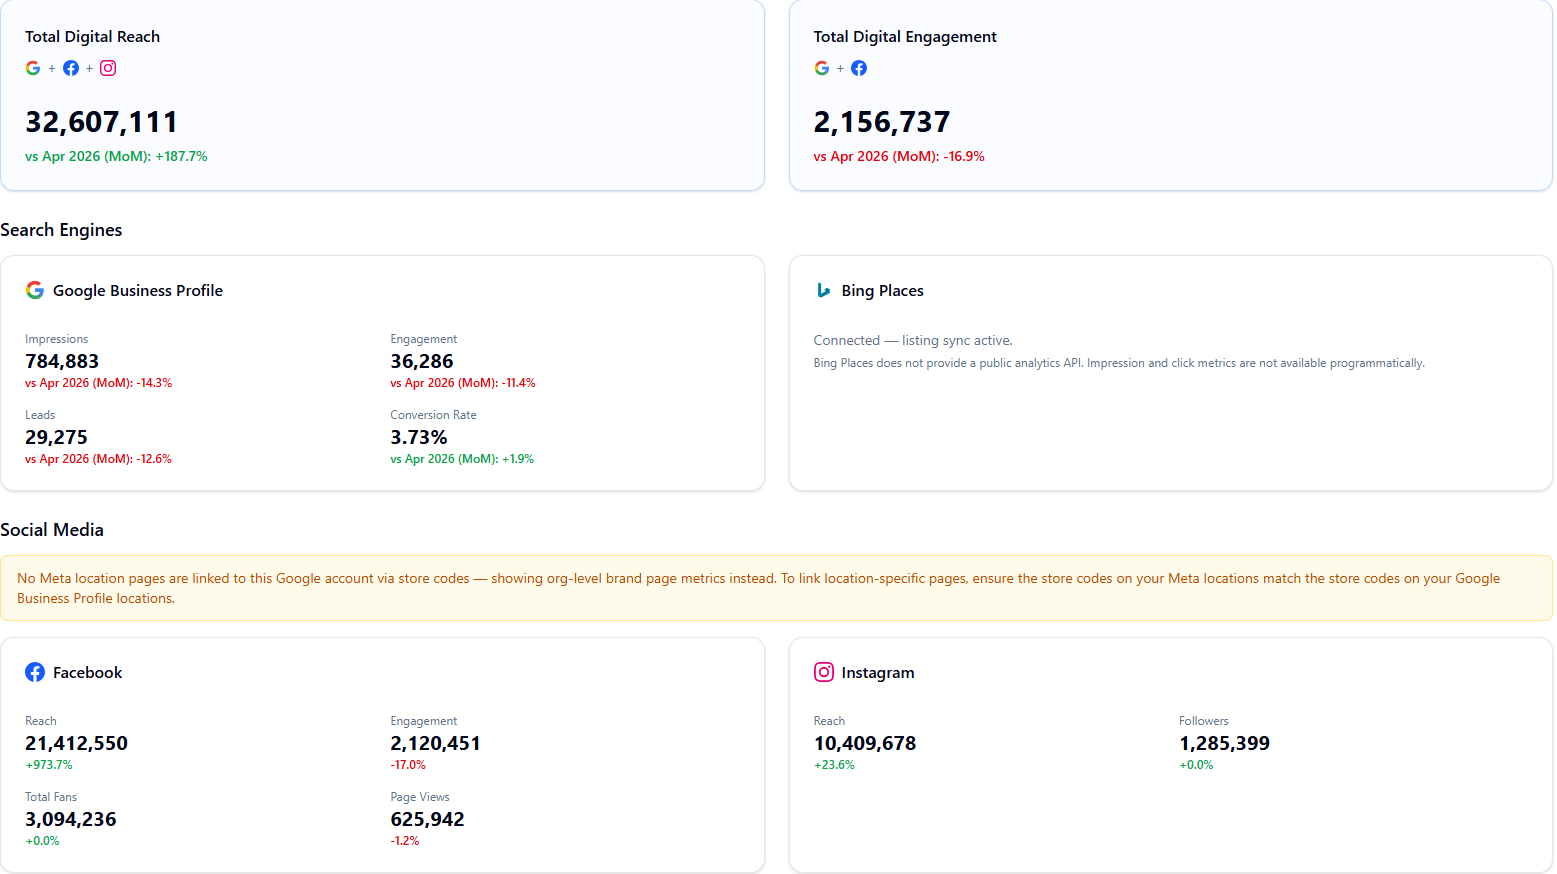
Digital Performance Overview If you have connected your Facebook and Instagram pages via the Integrations tab, a combined reach and engagement summary will appear above your GBP metrics.
-
It displays your Total Digital Reach and Total Digital Engagement across all three platforms combined.
-
It breaks down specific platform metrics (e.g., Facebook page views, Instagram followers) alongside percentage changes versus the previous period.
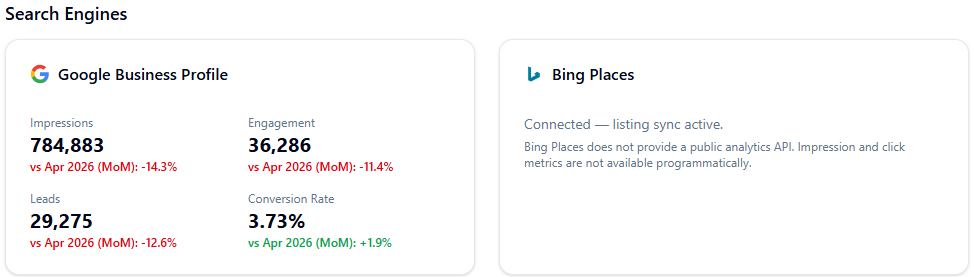
Google Business Profile (GBP) Metrics This section breaks down your core local SEO performance:
-
Impressions: Total visibility across Google Maps and Google Search.
-
Engagement: Total interactions (website clicks, calls, direction requests).
-
Leads: A specific sum of high-value actions (calls, messages, bookings).
-
Note: For Month, Quarter, and Year views, the system automatically calculates Month-on-Month (MoM) and Year-on-Year (YoY) comparisons.
Search Queries (Requires Local SEO Add-on) If your organization utilizes the Local SEO add-on, this section breaks down how customers are finding you, displaying Direct queries (brand-name searches), Indirect queries (category/service searches), and your branded vs. non-branded query share.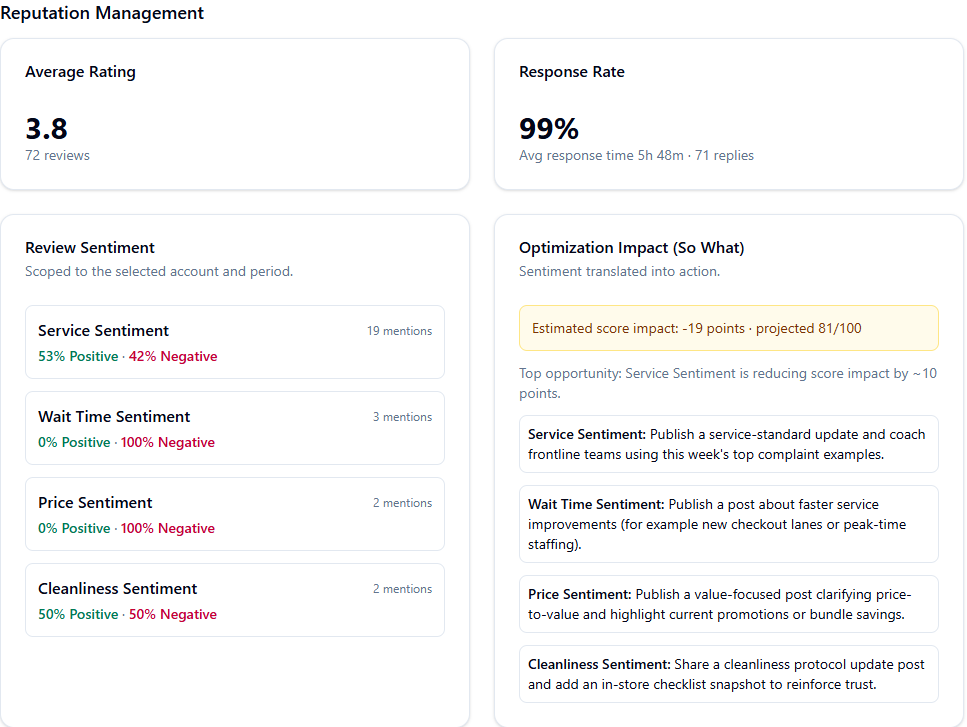
Reputation Health & Sentiment A snapshot of your overall brand perception, displaying your Average Rating, Total Reviews, Response Rate, and Average Response Time.
-
Transactional Sentiment: This tool breaks down customer sentiment by topic group (Service, Price, Cleanliness, Wait Time, Product Quality), providing an Optimization Impact estimate and recommended actions to fix operational friction.
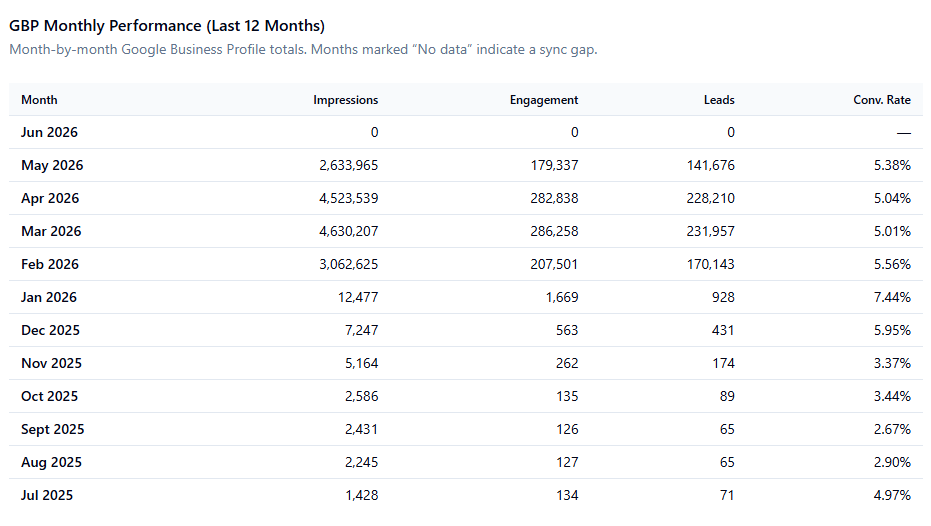
12-Month GBP Performance Summary A historical table at the bottom of the report tracks your impressions, engagement, and leads over the last year. Months with missing data are visually dimmed so data gaps are immediately obvious.
Exporting and Deep Dives
Once your report is generated, use the action buttons at the top of the page to distribute or analyze the data:
-
Download PDF: Generate a clean, branded PDF of the current report for client packs.
-
Export CSV: Download the raw metrics into a spreadsheet for custom data manipulation.
-
Deep Dive Handoff: Click "Use Executive Date Range in Reputation Insights". This instantly opens the Reputation module, pre-loaded with your exact date range and account scope, allowing you to seamlessly investigate the specific reviews driving your metrics.
Benchmarks & Interpretation Tips
When presenting this data to clients or stakeholders, keep these industry benchmarks in mind:
-
Response Rate: Aim for a minimum of 80%. A rate below 60% indicates to Google (and customers) that reviews are not being actively managed.
-
Response Time: Target under 24 hours. (Note: The report calculates response time based strictly on business hours, ensuring weekend delays do not artificially penalize your metrics).
-
Query Share: A high percentage of Direct queries indicates very strong local brand recognition, whereas a high percentage of Indirect queries means your non-branded local SEO strategy is working well to attract new customers.
- ✓ Navigate to Reports → Executive.
- ✓ Select your desired Account and Period Type (e.g., Month).
- ✓ Click Run report.
- ✓ Review the AI-generated Performance Narrative.
- ✓ Download the PDF for your client or board pack.
- ✓ Use the Handoff button to drill into the Reputation Insights tab for a deeper analysis.
AI answers may be approximate. Verify critical steps in official docs above.