Analyzing the Locations Performance Report
ProfilePilot Team | Jun 10, 2026 | 4 min read
While the Executive Report provides a macro-level view of your digital footprint, successful local SEO requires granular, store-by-store accountability. The Locations Performance Report breaks down your organization's Google Business Profile (GBP) performance into a detailed, sortable table. This allows you to view impressions, engagement actions, lead generation, reputation metrics, and profile accuracy scores for every individual location side-by-side.
Accessing and Filtering the Data
Navigate to Reports in the left sidebar, then select the Locations tab. The report will automatically load using your default dashboard filters.
(Note: The Reports module uses a unified tab bar. If you switch between the Executive, Locations, Reputation, and Listing Accuracy tabs, your chosen filters seamlessly pass through to the next view.)
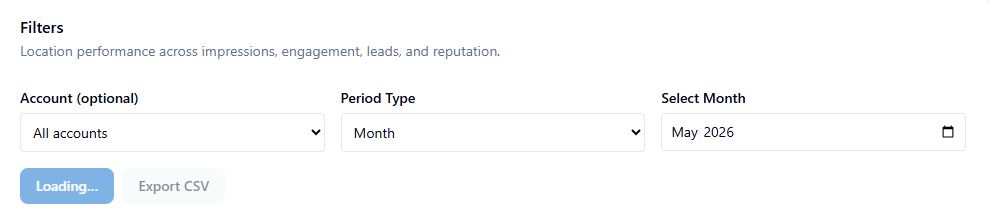
Configuring Your Scope:
-
Account (Optional): Filter the table to a specific Google Business account or leave it blank to view all locations across the organization.
-
Period Type: Select Month to pick a specific calendar month, or select Days to view a rolling window of 7, 30, 60, or 90 days.
-
Click Run report to instantly refresh the data table.
Understanding the Metrics Table
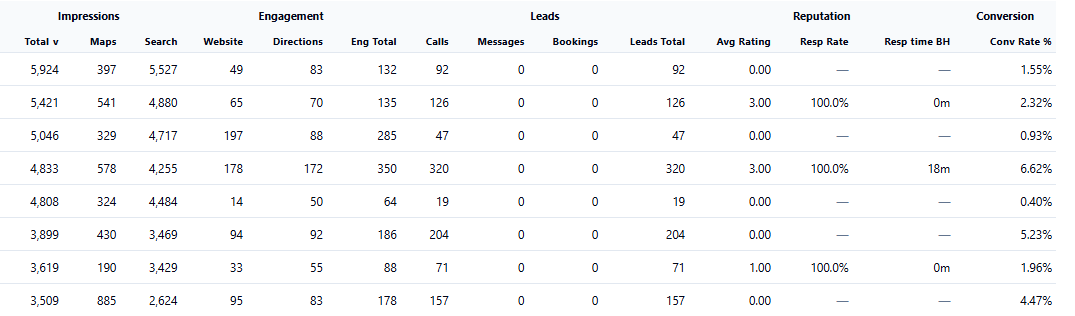
Each row in the report represents a single location. You can click any column header to sort the data in ascending or descending order. Empty cells (displayed as "—") indicate that no data was recorded for that specific metric during the chosen time period.
Here is a breakdown of the available columns:
Identification & Visibility
-
Store Code & Location: Your internal identifier and the public business name from Google.
-
Impr Total / Maps / Search: Total search visibility, cleanly split between users who found you on Google Maps versus standard Google Search.
Customer Actions & Leads
-
Engagement: The total aggregate of all customer interactions with the profile.
-
Website Clicks & Directions: Specific counts for users visiting your site or requesting driving directions.
-
Calls / Messages / Bookings: Individual tracking for the three highest-intent customer actions.
-
Leads: A composite metric combining your total Calls, Messages, and Bookings.
-
Conv Rate % (Conversion Rate): The percentage of your total visibility that resulted in a high-intent lead (Leads ÷ Impressions × 100).
Reputation & Health
-
Avg Rating: The location's mean star rating out of 5.0.
-
Resp Rate %: The percentage of reviews this specific location has replied to.
-
Resp Time BH: The average time it takes the location to reply to reviews, calculated in strictly Business Hours.
-
Accuracy Score / Missing: Pulled directly from the Location Accuracy data, this shows the profile's completeness score and the exact number of missing fields (e.g., missing phone numbers or hours).
A Totals Row at the bottom of the table dynamically aggregates the values across all visible rows to give you a quick portfolio summary.
Exporting the Report
-
Raw Data: Click the Export CSV button to download the full table as a spreadsheet. The filename automatically includes the date range, account name, and a timestamp, making it perfect for custom Excel or Google Sheets analysis.
-
Client Presentations: If you need a polished, branded PDF output to send to a client, navigate back to the main Reports index page and use the Combined Report PDF feature.
Best Practices & Quick Tasks
This report is your primary diagnostic tool for identifying operational bottlenecks.
-
Audit Conversion Rates: Sort by Conv Rate % (ascending). Look for locations that have high impressions but incredibly low conversion rates. This usually indicates a poor profile presentation (e.g., bad primary photos or a low star rating) that is scaring searchers away before they convert.
-
Triage Reputation Operations: Sort by Resp Rate % to immediately flag which specific store managers or regions are failing to reply to their customer reviews.
-
Fix Accuracy Leaks: Scan the Accuracy Score column to find locations missing critical data, then click over to the Listing Accuracy tab to investigate and patch the missing fields.
Quick Tasks
- ✓✓ Navigate to the Locations tab in Reports.
- ✓✓ Set your Period Type to align with your reporting cycle (e.g., Month).
- ✓✓ Click a column header (like Leads or Avg Rating) to sort the data.
- ✓✓ Review the Accuracy Score column to identify incomplete profiles.
- ✓✓ Export the table as a CSV for deeper team analysis.
Keep learning
See the latest guides, experiments, and rollouts.