Tracking Social Post Engagement
To run a successful social media strategy across multiple locations, you need to know exactly how your audience is reacting to your content. ProfilePilot aggregates the performance data of your published Facebook and Instagram posts directly into your Social Inbox, giving you a clear view of your engagement without having to log into native social platforms. Note: Google Business Profile posts are managed separately in the Reputation module and do not appear in the Social Inbox.
Where to Find Your Post Engagement
Unlike traditional analytics dashboards that separate your metrics from your community management, ProfilePilot nests your post performance data right above your comment threads.
To view your engagement:
-
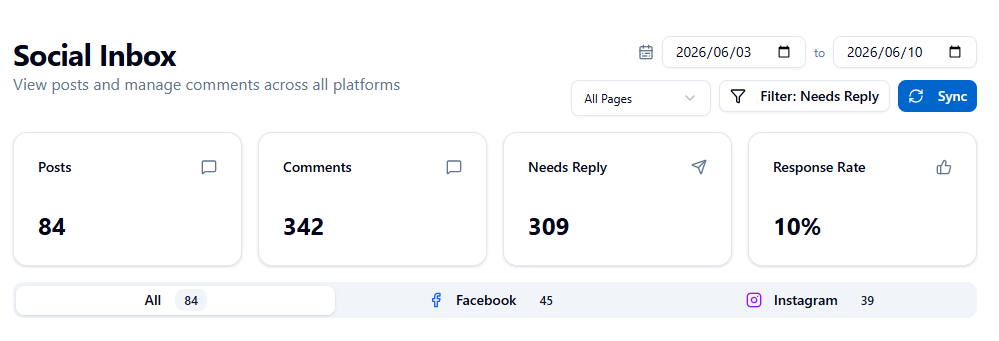
Navigate to Dashboard → Posts → Social Inbox.
-
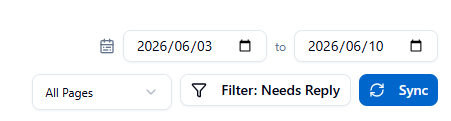
Set Your Timeframe: Use the date range pickers in the top-right corner to choose your time window (the dashboard defaults to the last 7 days).
-
Filter Your View: Use the platform tabs (All, Facebook, Instagram) to focus on a specific network, or use the Page Selector to drill down into a specific location's performance.
-
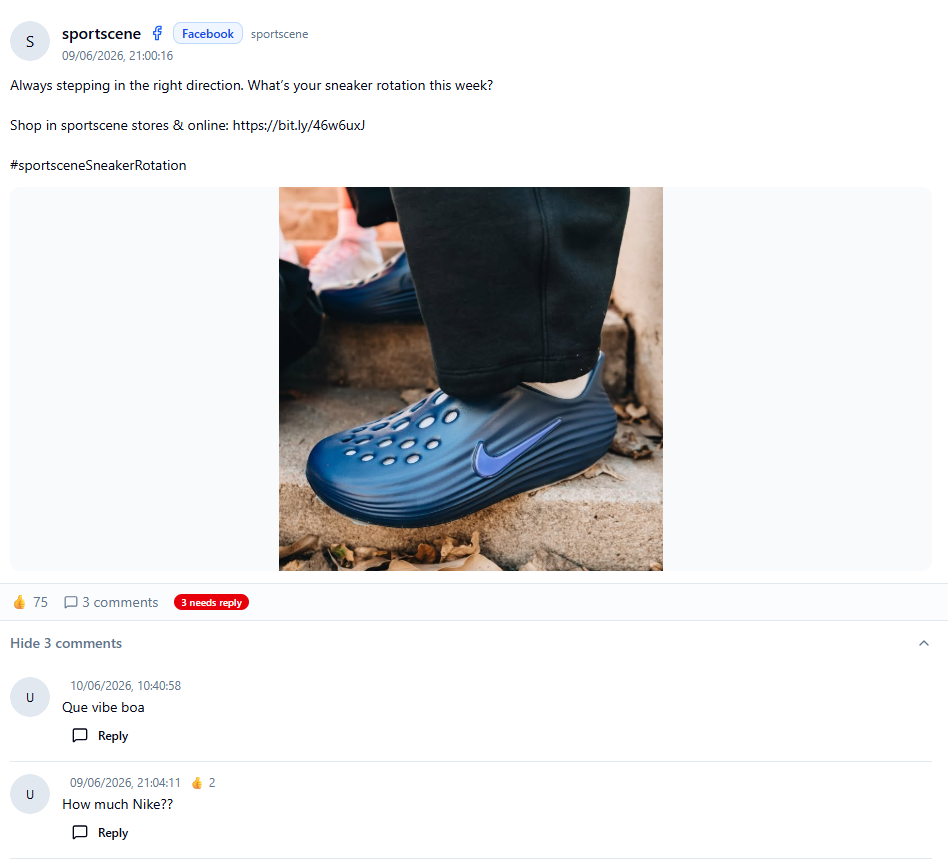
Locate a Post Card in the feed. The engagement metrics bar is displayed prominently below the post content and images.

Understanding Your Engagement Metrics
Each Post Card features a comprehensive metrics bar that breaks down exactly how users interacted with that specific piece of content.
Here is what each metric means:
-
👍 Likes: The number of standard "like" reactions the post received.
-
❤️ Total Reactions: The combined sum of all reaction types (Like, Love, Care, Haha, Wow, Sad, Angry).
-
🔄 Shares: How many times users shared the post to their own feeds or with friends.
-
👁️ Impressions: The total number of times the post was displayed on a screen. (Note: If the same user sees the post three times, it counts as three impressions).
-
📊 Reach: The number of unique individual users who saw the post.
-
📈 Engagement Rate: The percentage of your Reach that actively engaged with the post (clicked, liked, commented, or shared).
-
💬 Comments: The total comment count is shown at the bottom of the card. You can click "View [X] comments" to instantly read the thread and reply.
Syncing Your Data
Social media moves fast. To ensure you are looking at the most accurate performance data, click the Sync button in the top-right corner of the Social Inbox.
This triggers an immediate API pull from Meta, fetching any newly published posts and refreshing the engagement metrics (new likes, shares, and reach) for your existing posts.
How to Create New Posts
While the Social Inbox is where you track and manage your published Facebook and Instagram content, it is not where you create it.
To build, schedule, and publish new content, you must navigate to Dashboard → Posts. This will open the Smart Post Wizard, which allows you to generate AI-assisted copy, upload media, and bulk-publish posts to Google Business Profile, Facebook, and Instagram simultaneously.
- ✓ Navigate to the Social Inbox to view your Facebook and Instagram feeds.
- ✓ Adjust the date range to analyze older post campaigns.
- ✓ Click the Sync button to refresh your latest Meta engagement metrics.
- ✓ Review the Engagement Rate (📈) to see which types of content resonate best with your audience.
- ✓ Navigate to the Posts module when you are ready to create and schedule your next campaign.
AI answers may be approximate. Verify critical steps in official docs above.